 Skip to content

Pedestrian crashes in San Francisco between 5 and 8 p.m. rose 32% in the four weeks after clocks fell back each November compared with the four weeks before, while total pedestrian crashes held steady, according to a Pacific Law Firm analysis of 11 years of state crash data. Across 2015 to 2025, the city recorded 178 evening pedestrian crashes in the four weeks after the change and 135 in the four weeks before. Over the same days, crashes at all hours barely moved: 690 after and 694 before.
Clocks fall back again at 2 a.m. on Sunday, 1 November 2026, the first Sunday in November under federal law. The data suggests the change does not add pedestrian crashes so much as move them into the hours that suddenly turn dark.
Key findings
- In the four weeks after clocks fell back, San Francisco recorded 178 pedestrian crashes between 5 and 8 p.m., up 32% from 135 in the four weeks before (2015 to 2025 combined).
- Over the same weeks, pedestrian crashes at all hours were flat (694 before, 690 after), and morning crashes between 6 and 9 a.m. fell 6%.
- The 6 to 7 p.m. hour saw the sharpest jump: 72 crashes after the change, up 80% from 40 before.
- In March, when clocks spring forward, the pattern reverses: San Francisco’s 5 to 8 p.m. pedestrian crashes fell 33%, from 142 to 95.
- Evening crashes rose after the fall change in 10 of the 11 years studied.
- From November to January, 49% of San Francisco pedestrian crashes happened in the dark, compared with 31% from February to October.
21% of San Francisco pedestrian crashes in the dark killed or severely injured someone, compared with 13% of crashes in daylight.
What happens to pedestrian crashes when the clocks fall back?
San Francisco’s evening pedestrian crashes rise sharply in the four weeks after the change, while the rest of the day stays level or falls. The 5 to 8 p.m. window went from 135 crashes in the four weeks before the change to 178 in the four weeks after, counting all 11 years together.
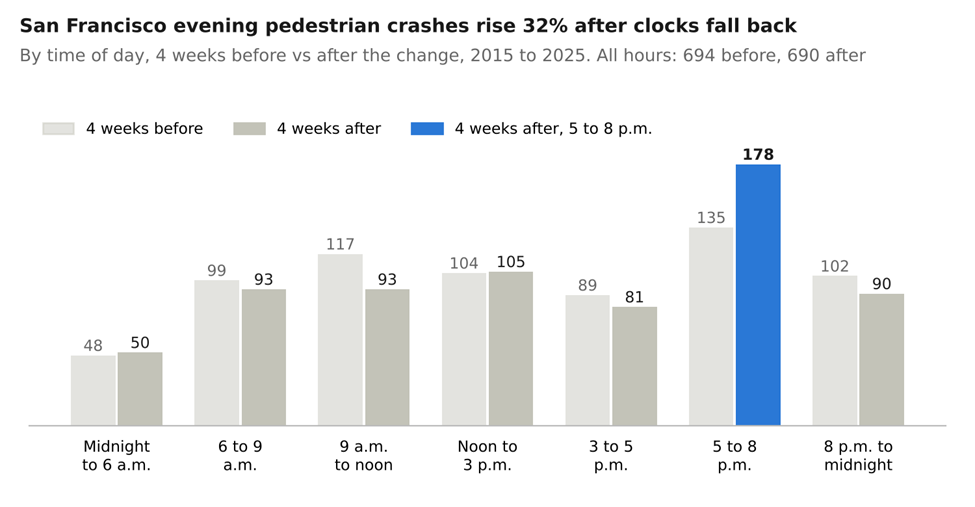
Source: SWITRS pedestrian crash records via UC Berkeley SafeTREC TIMS, San Francisco, 2015 to 2025 (2025 preliminary). 28 days before vs 28 days on and after each fall clock change. Pacific Law Firm analysis.
The shift is concentrated in the hours that change from daylight to darkness. Before the change, 41% of the city’s 5 to 8 p.m. pedestrian crashes happened in the dark. After it, 86% did. The single hour from 6 to 7 p.m. went from 40 crashes to 72, an 80% rise. The hour before it, 5 to 6 p.m., rose 19%, from 52 to 62. The hour after it, 7 to 8 p.m., was already dark before the change and barely moved, from 43 to 44.
Mornings move the other way. Because the change brings earlier sunrises, the 6 to 9 a.m. window had 93 crashes after the change, down from 99. Across all hours, the totals were almost identical: 694 before and 690 after.

Is it the season or the clock?
The spring clock change suggests the clock itself matters. When clocks spring forward in March and evenings suddenly stay light, San Francisco’s 5 to 8 p.m. pedestrian crashes fall by about a third, from 142 in the four weeks before to 95 in the four weeks after.

Source: SWITRS pedestrian crash records via UC Berkeley SafeTREC TIMS, San Francisco, 2015 to 2025 (2025 preliminary). Pacific Law Firm analysis.
The fall pattern also held almost every year. Evening crashes were higher in the four weeks after the change than in the four weeks before in 10 of the 11 years from 2015 to 2025. The one exception was 2025, when they fell from 18 to 14; 2025 figures are preliminary.
| Year | 5 to 8 p.m. pedestrian crashes, 4 weeks before | 4 weeks after |
| 2015 | 9 | 17 |
| 2016 | 20 | 24 |
| 2017 | 7 | 16 |
| 2018 | 9 | 15 |
| 2019 | 21 | 23 |
| 2020 | 7 | 14 |
| 2021 | 12 | 14 |
| 2022 | 9 | 12 |
| 2023 | 13 | 15 |
| 2024 | 10 | 14 |
| 2025 (preliminary) | 18 | 14 |
| Total | 135 | 178 |
The same comparison across San Francisco, Oakland, San Jose and Berkeley combined shows a 42% rise in fall, from 289 evening crashes to 410, and a 44% drop in spring, from 306 to 170.
Which months are darkest for San Francisco pedestrians?
December and January are the darkest months for pedestrian crashes in San Francisco. In December, 53% of the city’s pedestrian crashes happened in the dark, compared with 23% in June. January followed at 51% and November at 44%, up from 31% in October.

Source: SWITRS pedestrian crash records via UC Berkeley SafeTREC TIMS, San Francisco, 2015 to 2025 (2025 preliminary). Pacific Law Firm analysis.
The evening rush feels this most. From May through August, almost none of San Francisco’s 5 to 8 p.m. pedestrian crashes happened in the dark. In December, 92% did.
Are pedestrian crashes after dark more serious?
Crashes in the dark are more likely to end in death or serious injury. In San Francisco, 21% of pedestrian crashes in the dark killed or severely injured someone, compared with 13% of crashes in daylight. Of the city’s 202 fatal pedestrian crashes from 2015 to 2025, 115 (57%) happened in the dark, although darkness accounted for 36% of all pedestrian crashes.
Across the four cities, 25% of pedestrian crashes in the dark killed or severely injured someone, compared with 12% in daylight, and 401 of the 606 fatal pedestrian crashes (66%) happened in the dark.
Which San Francisco streets see the most pedestrian crashes after dark?
Mission Street had the most pedestrian crashes in the dark of any San Francisco street from 2015 to 2025, with 238, followed by Geary (113) and Market (102). On Van Ness Avenue, nearly half of all pedestrian crashes (48%) happened in the dark.
| Street | Pedestrian crashes in the dark, 2015 to 2025 | All pedestrian crashes | Share in the dark |
| Mission Street | 238 | 607 | 39% |
| Geary Boulevard and Geary Street | 113 | 294 | 38% |
| Market Street | 102 | 317 | 32% |
| Van Ness Avenue | 97 | 201 | 48% |
| Eddy Street | 83 | 187 | 44% |
| Polk Street | 77 | 170 | 45% |
| Hyde Street | 76 | 187 | 41% |
| 16th Street | 76 | 180 | 42% |
| 6th Street | 74 | 190 | 39% |
| 3rd Street | 65 | 237 | 27% |
| Larkin Street | 64 | 164 | 39% |
| Leavenworth Street | 59 | 136 | 43% |
The same streets lead in the darkest evenings of the year. Between November and January, from 5 to 8 p.m., Mission Street had 35 pedestrian crashes in the dark and Geary had 26, more than any other streets in the city. Many of the top streets run through the Tenderloin, the Mission and South of Market.
How do Oakland, San Jose and Berkeley compare?
All four cities saw evening pedestrian crashes rise after clocks fell back and fall after they sprang forward. The table shows each city’s figures for 2015 to 2025.
| City | Fall: 5 to 8 p.m. crashes, before and after | Change | Spring: before and after | Change | Killed or severely injured, dark | Killed or severely injured, daylight | Fatal crashes in the dark |
| San Francisco | 135 to 178 | +32% | 142 to 95 | −33% | 21% | 13% | 115 of 202 |
| Oakland | 48 to 82 | +71% | 59 to 26 | −56% | 26% | 12% | 88 of 131 |
| San Jose | 74 to 115 | +55% | 78 to 31 | −60% | 34% | 12% | 183 of 252 |
| Berkeley | 32 to 35 | +9% | 27 to 18 | −33% | 23% | 12% | 15 of 21 |
Berkeley’s counts are small, so its percentages can swing widely from year to year. San Jose had the largest gap in severity: 34% of its pedestrian crashes in the dark killed or severely injured someone, compared with 12% in daylight.
What can this data not show?
These are crash counts, not rates. The data does not show how many people were walking at each hour, so it cannot measure risk per pedestrian, and a busy street will show more crashes partly because more people use it. The lighting condition in each record is noted by the officer who wrote the report, and some records leave it blank. The pattern is consistent across years and cities, but it is an association, not proof that the clock change causes crashes.
The calendar also plays a part. Halloween always falls in the four weeks before the fall change, and Thanksgiving always falls in the four weeks after it, so holiday travel and events are part of both windows.
What does this mean for people hit while walking?
Darkness does not change the basic rules of the road in California, and it does not change how a personal injury claim works.
- Drivers must yield in crosswalks. Under California Vehicle Code section 21950, drivers must yield the right-of-way to pedestrians crossing in a marked crosswalk or an unmarked crosswalk at an intersection, and must use due care, slowing down or taking other action to keep the pedestrian safe.
- Pedestrians have duties too. The same section says pedestrians must use due care for their own safety and must not step suddenly into the path of a vehicle close enough to be an immediate hazard.
- Outside a crosswalk, drivers still owe care. Under California Vehicle Code section 21954, a pedestrian crossing outside a crosswalk must yield to vehicles close enough to be a hazard, but drivers still have a duty to use due care for any pedestrian on the roadway.
- Time limits apply. California Code of Civil Procedure section 335.1 generally allows two years to bring a claim for injury or death caused by the wrongful act or neglect of another, including wrongful death claims brought by families. Other deadlines can be shorter in some situations.
People with questions about how this affects an injury claim can request a free consultation.
Methodology
Pedestrian crash records for San Francisco, Oakland, San Jose and Berkeley from the California Highway Patrol’s Statewide Integrated Traffic Records System (SWITRS), downloaded through UC Berkeley SafeTREC’s Transportation Injury Mapping System on 12 October 2026; analysis covers 2015 to 2025, with 2025 figures preliminary.
Clock change dates follow 15 U.S.C. 260a (fall: first Sunday in November; spring: second Sunday in March). Each comparison counts crashes in the 28 days before and the 28 days on and after the change, summed across all 11 years, by the hour recorded in the crash report.
“Dark” combines the report’s three dark categories (with street lights, without street lights, street lights not working); dusk and dawn are counted separately, and records without a lighting condition are excluded from lighting shares. Street counts include each crash once for every street the report names.
Sources
UC Berkeley SafeTREC, Transportation Injury Mapping System (TIMS) – SWITRS pedestrian crash records used for this analysis https://tims.berkeley.edu/
15 U.S.C. 260a, U.S. Government Publishing Office – federal start and end dates for daylight saving time https://www.govinfo.gov/content/pkg/USCODE-2011-title15/html/USCODE-2011-title15-chap6-subchapIX-sec260a.htm
California Vehicle Code section 21950 – pedestrian right-of-way at crosswalks https://leginfo.legislature.ca.gov/faces/codes_displaySection.xhtml?lawCode=VEH§ionNum=21950
California Vehicle Code section 21954 – pedestrians outside crosswalks and the driver’s duty of care https://leginfo.legislature.ca.gov/faces/codes_displaySection.xhtml?lawCode=VEH§ionNum=21954
California Code of Civil Procedure section 335.1 – two-year time limit for injury and death claims https://leginfo.legislature.ca.gov/faces/codes_displaySection.xhtml?lawCode=CCP§ionNum=335.1
Journalists may use these figures with a link to this page; the full table is available as a download.
This article is for general informational purposes only and is not legal advice. Reading it does not create an attorney-client relationship.