 Skip to content

Self-driving vehicles were involved in 378 crashes in San Francisco reported to federal regulators between June 2025 and August 2026, and in 253 of them (67%) the robotaxi was stopped or parked when the crash happened, according to a Pacific Law Firm analysis of National Highway Traffic Safety Administration (NHTSA) data. San Francisco accounted for 49% of all robotaxi crashes reported in California over the same period.
The numbers matter now because California has just changed the rules. SB 1246, approved on 30 September 2026, sets new duties for how autonomous vehicle companies respond to crashes and stalled vehicles, and from 1 July 2028 it requires the Department of Motor Vehicles to publish quarterly summary statistics by manufacturer. Until then, the public record of robotaxi crashes in San Francisco is split across two datasets, and neither tells the whole story on its own.
Key findings
- San Francisco had 378 robotaxi crashes in reports submitted to NHTSA from June 2025 through August 2026, 49% of California’s 766.
- In 253 of San Francisco’s 378 crashes (67%), the robotaxi was stopped or parked, and in 319 (84%) it was traveling at 5 mph or less.
- An injury was alleged in 31 of the 378 crashes (8%). No San Francisco report in the period alleged a serious or fatal injury.
- Heavy trucks and buses were the other vehicle in 78 San Francisco robotaxi crashes (21%).
- 18 crashes involved a motorcyclist, cyclist, scooter or skateboard rider, or pedestrian.
- Of 854 collision reports filed with the California DMV under autonomous vehicle testing permits since 2019, 609 (71%) were in San Francisco.
- Bryant Street (19 reports) and Mission Street (18) appear most often in San Francisco’s autonomous-mode DMV testing reports since 2019.
How many robotaxi crashes happened in San Francisco?
San Francisco recorded 378 crashes involving vehicles running automated driving systems in reports submitted to NHTSA between June 2025 and August 2026. That is 49% of the 766 such crashes reported in California, and 26% of the 1,436 reported nationwide. Los Angeles was second in California with 247.
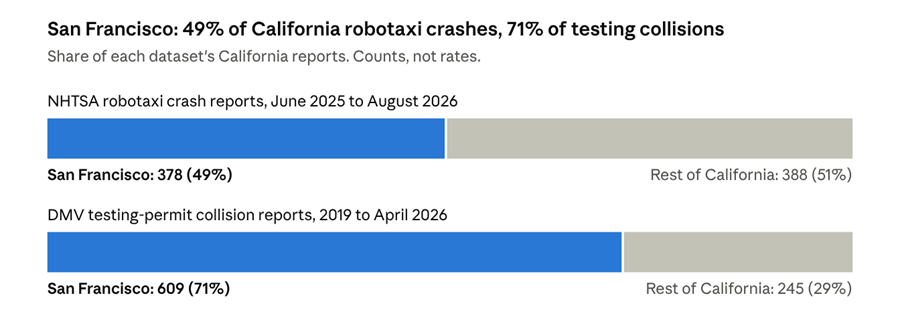
Source: NHTSA SGO 2021-01 ADS incident reports (submitted Jun 2025 to Aug 2026); DMV OL 316 reports via UC Berkeley SafeTREC (2019 to 26 Apr 2026). Pacific Law Firm analysis.
Two companies filed the San Francisco reports: Waymo (352) and Zoox (26). The automated driving system was engaged in 376 of the 378 crashes.
These are counts, not crash rates. NHTSA states that its data is not normalized for miles driven, and the companies run fleets of very different sizes over different areas. A higher count reflects more driving, not necessarily less safe driving, and is not a safety ranking of any company.
What was the robotaxi doing when the crash happened?
In 253 of the 378 crashes (67%), the reporting company said its vehicle was stopped (201) or parked (52) just before impact. It was proceeding straight in 91 crashes (24%), and turning, changing lanes, passing, entering traffic, parking or backing in the remaining 34.

Source: NHTSA SGO 2021-01 ADS incident reports, San Francisco, submitted Jun 2025 to Aug 2026, field ‘SV Pre-Crash Movement’. Pacific Law Firm analysis.
Speeds tell the same story. The robotaxi’s reported pre-crash speed was 0 mph in 261 crashes and 5 mph or less in 319 (84%).
In the 253 crashes where the robotaxi was stopped or parked, the other vehicle was most often proceeding straight (102), passing (65) or backing up (39). In 94 of those crashes the contact was at the robotaxi’s rear.
Vehicle movement in these reports is supplied by the company and describes what the vehicle was doing, not who was at fault. A vehicle that stops suddenly or in a travel lane can still play a part in a crash.

Which vehicles were involved in San Francisco robotaxi crashes?
Passenger cars (127) and SUVs (81) were the most common crash partners. Heavy trucks (48) and buses (30) together accounted for 78 crashes, or 21%.

Source: NHTSA SGO 2021-01 ADS incident reports, San Francisco, submitted Jun 2025 to Aug 2026, field ‘Crash With’. Pacific Law Firm analysis.
Eighteen crashes involved people outside a car or truck: 8 motorcyclists, 6 cyclists, 3 scooter or skateboard riders and 1 pedestrian. Six crashes involved a first responder vehicle, an issue SB 1246 addresses directly through its new rules on responding to emergency officials.
How many robotaxi crashes involved an injury?
An injury was alleged in 31 of the 378 San Francisco crashes (8%). Most were minor: 18 minor injuries without hospitalization and 9 with hospitalization. Four crashes alleged a moderate injury, and no San Francisco report in the period alleged a serious or fatal injury.
| Highest injury severity alleged | Crashes | Share |
| Property damage only, no injury reported | 333 | 88% |
| No injury reported | 4 | 1% |
| Unknown | 10 | 3% |
| Minor, without hospitalization | 18 | 5% |
| Minor, with hospitalization | 9 | 2% |
| Moderate, with hospitalization | 3 | 1% |
| Moderate, without hospitalization | 1 | under 1% |
| Serious or fatal | 0 | 0% |
| Total | 378 | 100% |
Injury severity in these reports is the highest level alleged at the time of reporting, as described by the company. It is not a medical finding, and companies can update a report when new information comes in. Of the 31 crashes with an alleged injury, 19 happened while the robotaxi was stopped or parked.
Where in San Francisco do autonomous vehicle collisions happen?
The NHTSA data removes street locations for privacy. For location, the best public source is the collision reports companies file with the California DMV under autonomous vehicle testing permits, compiled in UC Berkeley SafeTREC’s AV Safety Dashboard.
Since 2019, companies have filed 854 collision reports under California testing permits, and 609 of them (71%) were in San Francisco. Of those 609, 360 happened while the vehicle was in autonomous mode and 246 in conventional (human-driven) mode; 3 did not state a mode. In 197 of the 360 autonomous-mode collisions (55%), the company reported that its vehicle was stopped.
San Francisco reports peaked at 131 in 2022, fell to 59 in 2024 and rose to 77 in 2025. Waymo filed 265 of the San Francisco reports since 2019, Cruise 178 and Zoox 151. Cruise filed no San Francisco reports after 2023 in this data, and 2026 covers only 1 January to 26 April
.
Source: California DMV OL 316 collision reports (AVT and AVDT permits) via UC Berkeley SafeTREC AV Safety Dashboard, downloaded 9 Oct 2026. Pacific Law Firm analysis.
The table below counts each San Francisco autonomous-mode report once for every street it names. Most of the top streets run through South of Market and the Mission.
| Street | Autonomous-mode collision reports, 2019 to April 2026 |
| Bryant Street | 19 |
| Mission Street | 18 |
| Market Street | 14 |
| Folsom Street | 14 |
| 16th Street | 13 |
| Bush Street | 12 |
| Bayshore Boulevard | 12 |
| 9th Street | 11 |
| Harrison Street | 11 |
| Howard Street | 9 |
| Potrero Avenue | 9 |
| 7th Street | 9 |
| 17th Street | 8 |
| Brannan Street | 8 |
| Jerrold Avenue | 8 |
No single intersection stands out. The most frequent, Bayshore Boulevard and Jerrold Avenue, appears in 4 reports. Three reports name Mission Street at Angelos Alley, next to a vehicle parking garage, so some Mission Street reports may reflect vehicles entering or leaving that site.
What does the public data not show?
The two public datasets leave a gap. The federal data covers recent robotaxi service across San Francisco but hides the street. The state dashboard export shows the street, but it covers vehicles operating under testing permits. Neither dataset adjusts for how many miles each company drives in the city.
SB 1246 begins to address part of this. Under new Vehicle Code section 38805, autonomous vehicle manufacturers must keep records on response times of local incident technicians and on their responses to emergencies, system failures, immobilizations, obstructions, crashes and requests from emergency officials. They must give those records to the DMV every quarter, and the DMV must publish summary statistics, broken down by manufacturer, on its website each quarter.
Under section 38806, a city attorney or county counsel may seek civil penalties of up to $10,000 per vehicle that blocks or interferes with emergency or law enforcement operations for more than 30 minutes after an official requests a local incident technician. These provisions take effect 1 July 2028.
What does this mean for people involved in a robotaxi crash?
A crash with a robotaxi is handled under the same basic California rules as other traffic crashes, with extra records in play.
- The company’s report is not a finding of fault. Reports to NHTSA and the DMV are filed by the company and describe the crash from its point of view. Fault is decided separately, based on all the evidence.
- Drivers have their own reporting duty. Under California Vehicle Code section 16000, a driver in a crash that causes more than $1,000 in property damage, or any injury or death, must report it to the DMV within 10 days.
- Time limits apply. California Code of Civil Procedure section 335.1 generally allows two years to bring a claim for injury or death caused by the wrongful act or neglect of another. Other deadlines can be shorter in some situations.
- Keep your own record. Companies keep their own records and file their own reports. People involved in a crash can keep a record too: photos, the vehicle’s identifying number, the location and time, witness contacts and the police report number.
People with questions about how this affects an injury claim can request a free consultation.
Methodology
NHTSA: incident reports for automated driving systems under Standing General Order 2021-01, reports submitted June 2025 to August 2026 (file downloaded 9 October 2026), keeping the latest version of each report and one record per incident, filtered to San Francisco, California.
DMV: SafeTREC AV Safety Dashboard export of DMV autonomous vehicle collision reports (OL 316) under testing and driverless testing permits, downloaded 9 October 2026, covering 2019 to 26 April 2026; San Francisco identified by city or 941 ZIP code, street names standardized and counted once per report.
All figures are company-reported counts, not rates, and do not establish fault or compare company safety.
Sources
• NHTSA, Standing General Order on Crash Reporting – incident report data for automated driving systems. https://www.nhtsa.gov/laws-regulations/standing-general-order-crash-reporting
• NHTSA, SGO 2021-01 ADS incident reports (CSV) – data file used for this analysis. https://static.nhtsa.gov/odi/ffdd/sgo-2021-01/SGO-2021-01_Incident_Reports_ADS.csv
• California DMV, Autonomous Vehicle Collision Reports – collision reports filed by permit holders. https://www.dmv.ca.gov/portal/vehicle-industry-services/autonomous-vehicles/autonomous-vehicle-collision-reports/
• UC Berkeley SafeTREC, Autonomous Vehicles Safety Dashboard – compiled DMV testing collision data with download. https://safetrec.berkeley.edu/tools/autonomous-vehicles-safety-dashboard
• California Legislature, SB 1246 (2025 to 2026 session) – chaptered bill text, Chapter 1021, Statutes of 2026. https://leginfo.legislature.ca.gov/faces/billNavClient.xhtml?bill_id=202520260SB1246
• California Vehicle Code section 16000 – driver duty to report crashes to the DMV. https://leginfo.legislature.ca.gov/faces/codes_displaySection.xhtml?lawCode=VEH§ionNum=16000
• California Code of Civil Procedure section 335.1 – two-year time limit for injury and death claims. https://leginfo.legislature.ca.gov/faces/codes_displaySection.xhtml?lawCode=CCP§ionNum=335.1
Journalists may use these figures with a link to this page
This article is for general informational purposes only and is not legal advice. Reading it does not create an attorney-client relationship.